
As CoreDNS is an inception level project under the CNCF which means we have access to the physical cloud infrastructure of Packet, a bare metal(!) cloud provider. Physical machines imply performance and also because you get an entire machine you can use them for performance metrics.
For CoreDNS we have a few Benchmark tests (from the Go standard
library) that haven’t seen much use.
Typically you run these before your change and then after your and then use a tool like
benchcmp to compare the results and impress
your PR’s reviewers. This is all pretty manual, a more automated (and visual!) way would be welcome.
Our new Packet machines to the rescue. We’ve setup the following work flow:
GitHub > webhook > mbench > prometheus > grafana
I.e. we configured a webhook that gets triggered on a pull request and then via some Caddy proxy trigger gets delivered to webhook. Webhook then kicks of a shell script, that pulls down CoreDNS’ repo and the correct pull request. ^[Yes, this script parses the JSON with grep, ultimately that was the only way to make it reliably work.]
This benchmark script does nothing more
than run the bench mark tests: go test -run='' -bench=. -benchmem ./... 2>/dev/null).
The output from these tests, i.e:
BenchmarkRequestDo-8 1000000000 2.11 ns/op 0 B/op 0 allocs/op
… is written into the named pipe which is then picked up by mbench and converted into Prometheus metrics:
2017/06/25 09:21:51 [INFO] Parsed line: {branch="pr-753",cpu="8",subsystem="coredns"}requestdo_coredns: 1000000000 2.110000 0 0
The latest known branches are found by using a “recording rule” that uses an extra metrics that
mbench exports: _start_time_seconds:
So we only see the active branches from the last n branches:
benchmark_coredns_branches_topk10 = topk(10, benchmark_coredns_cacheresponse_start_time_seconds{branch != "master"})
There is also cron.hourly that tests master on a continuous basis, which we display separately in
Grafana.
Grafana
In Grafana, for each defined benchmark, we’ve setup a templated dashboard:
benchmark_coredns_[[benchmark]]_run_gauge{branch=~"$branch"}:
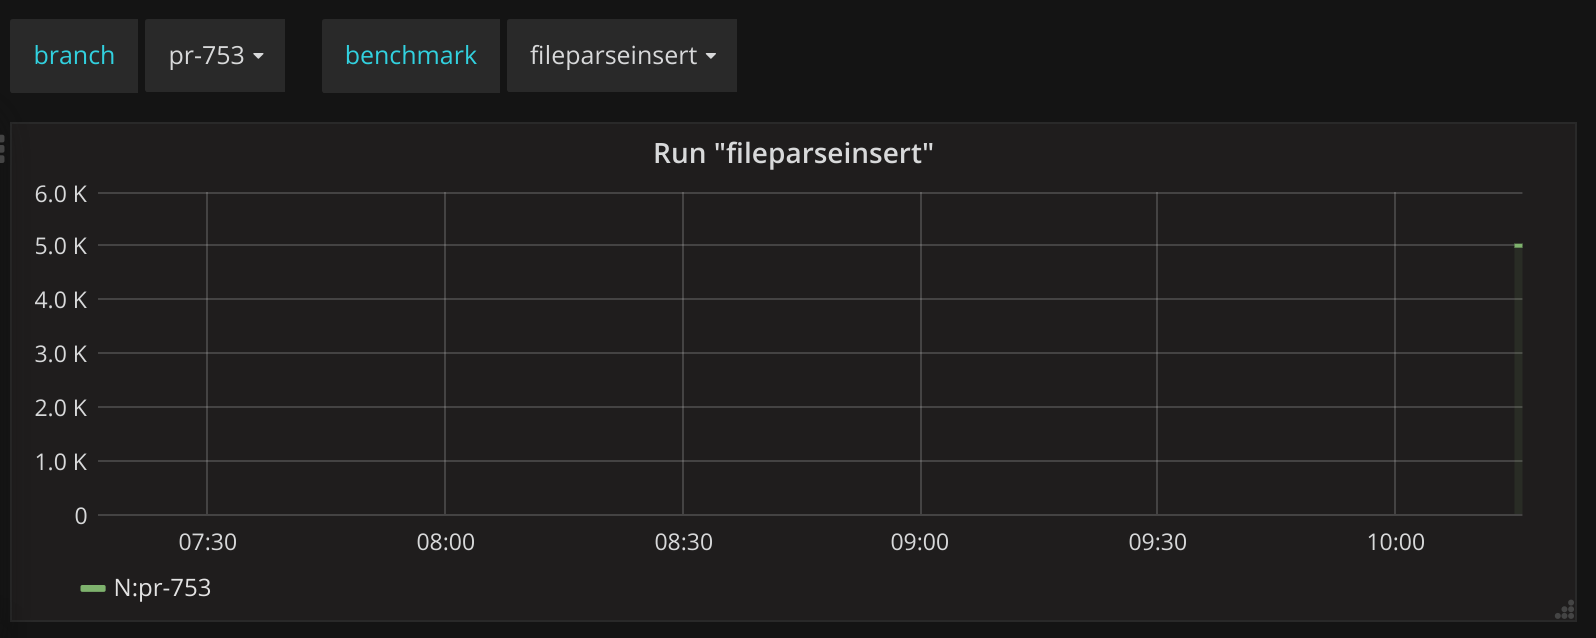
Branch and benchmark selectors in Grafana.
So we can easily select that branch and compare it with whatever other branch.
Thus in the end leading to a dashboard where you can easily compare your performance against the master branch: https://snapshot.raintank.io/dashboard/snapshot/0er0u40KAZ1YM4dl0KgDUkeD3KhzZqFj
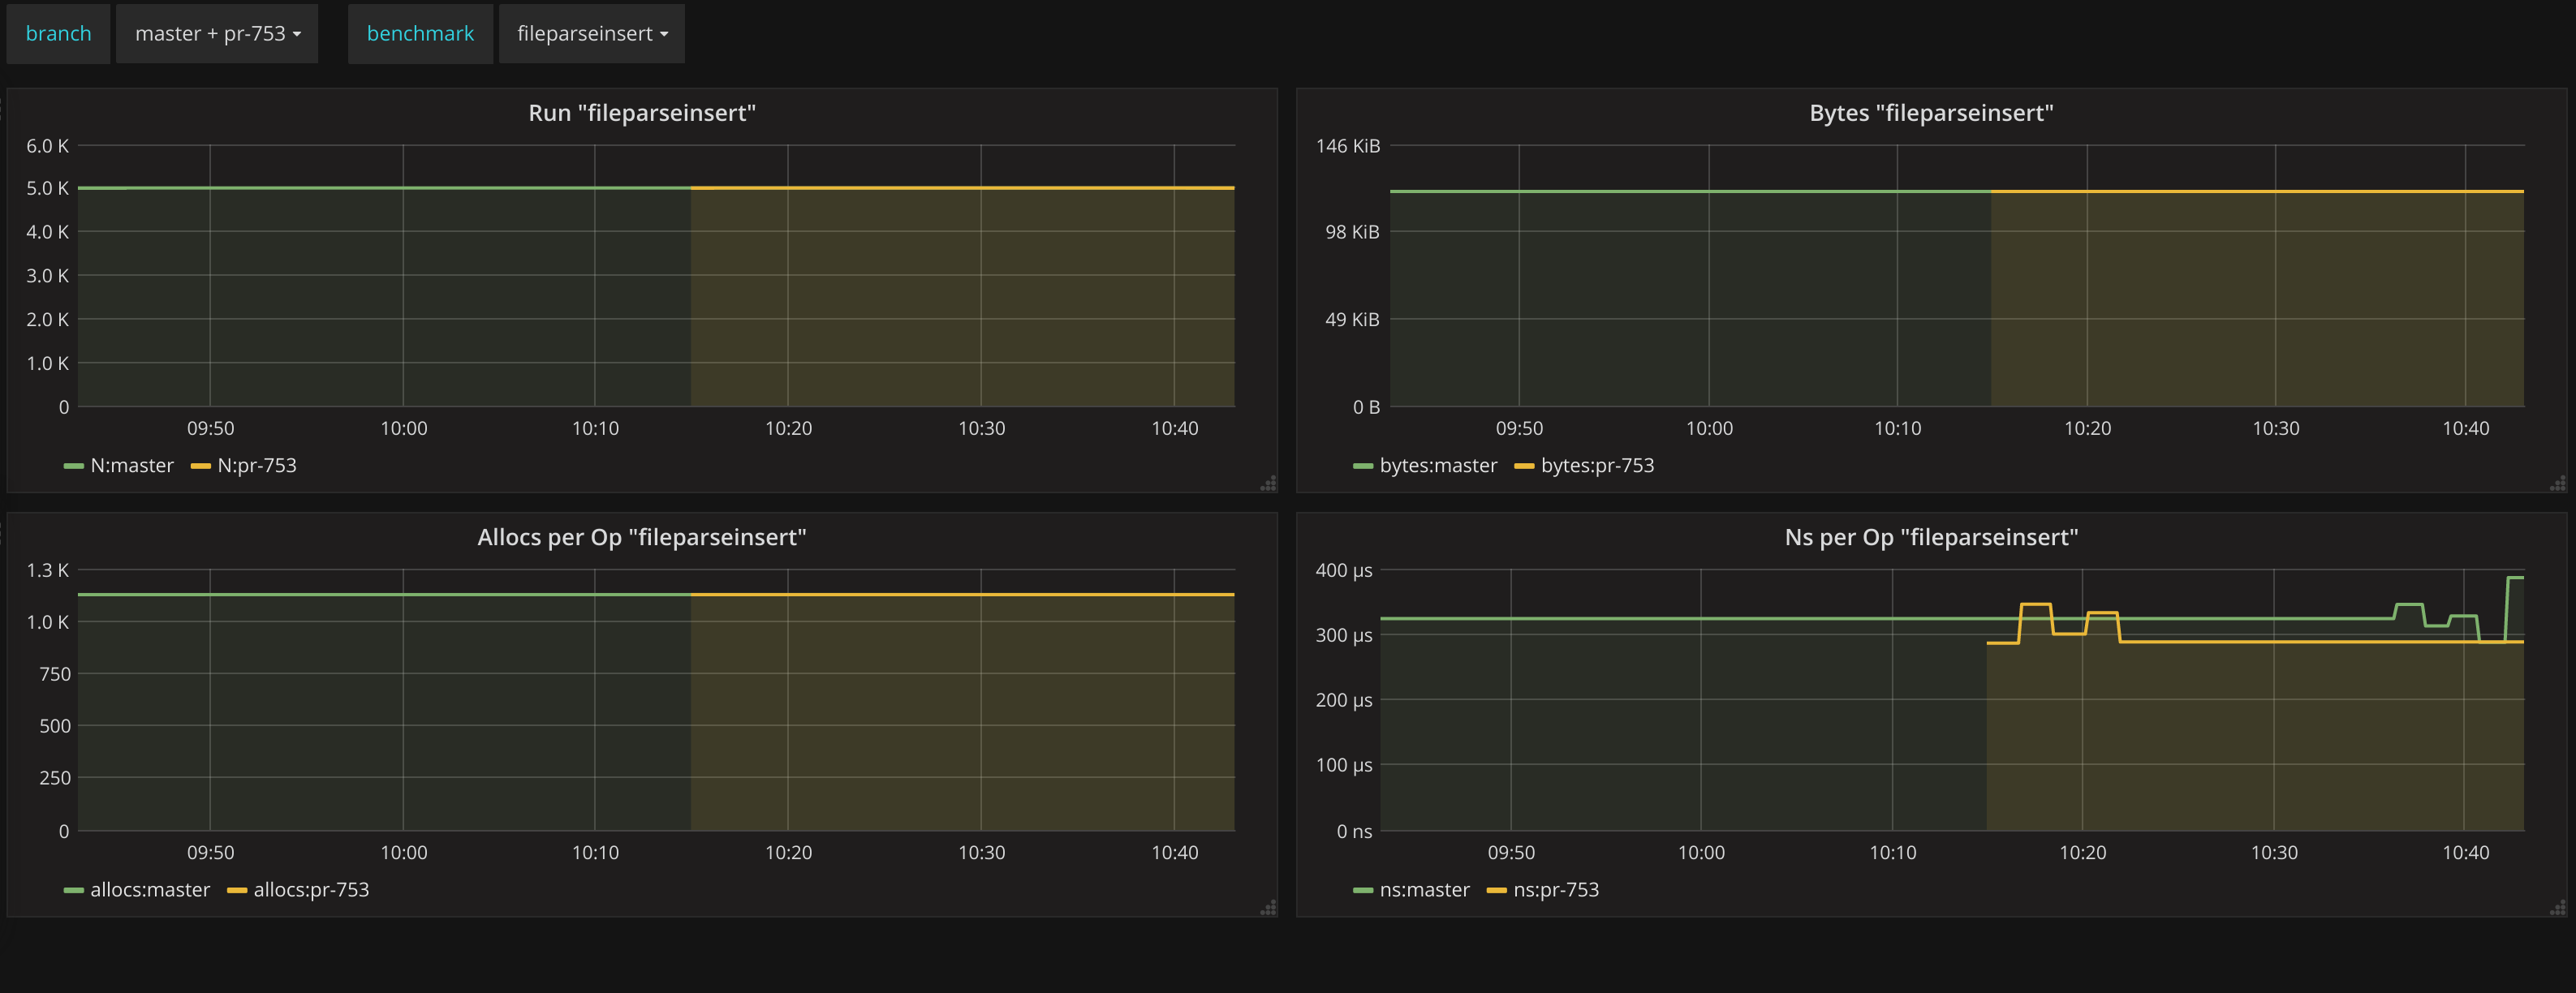
Benchmark dashboard.
The end result of all this is that if someone adds an optimization it will be immediately visible in the stats. Any new pull request shows up automatically and any new benchmark function will also be automatically discovered.